Back to Database
Rawgraphs
VERIFIED

Rawgraphs

0.0(0)

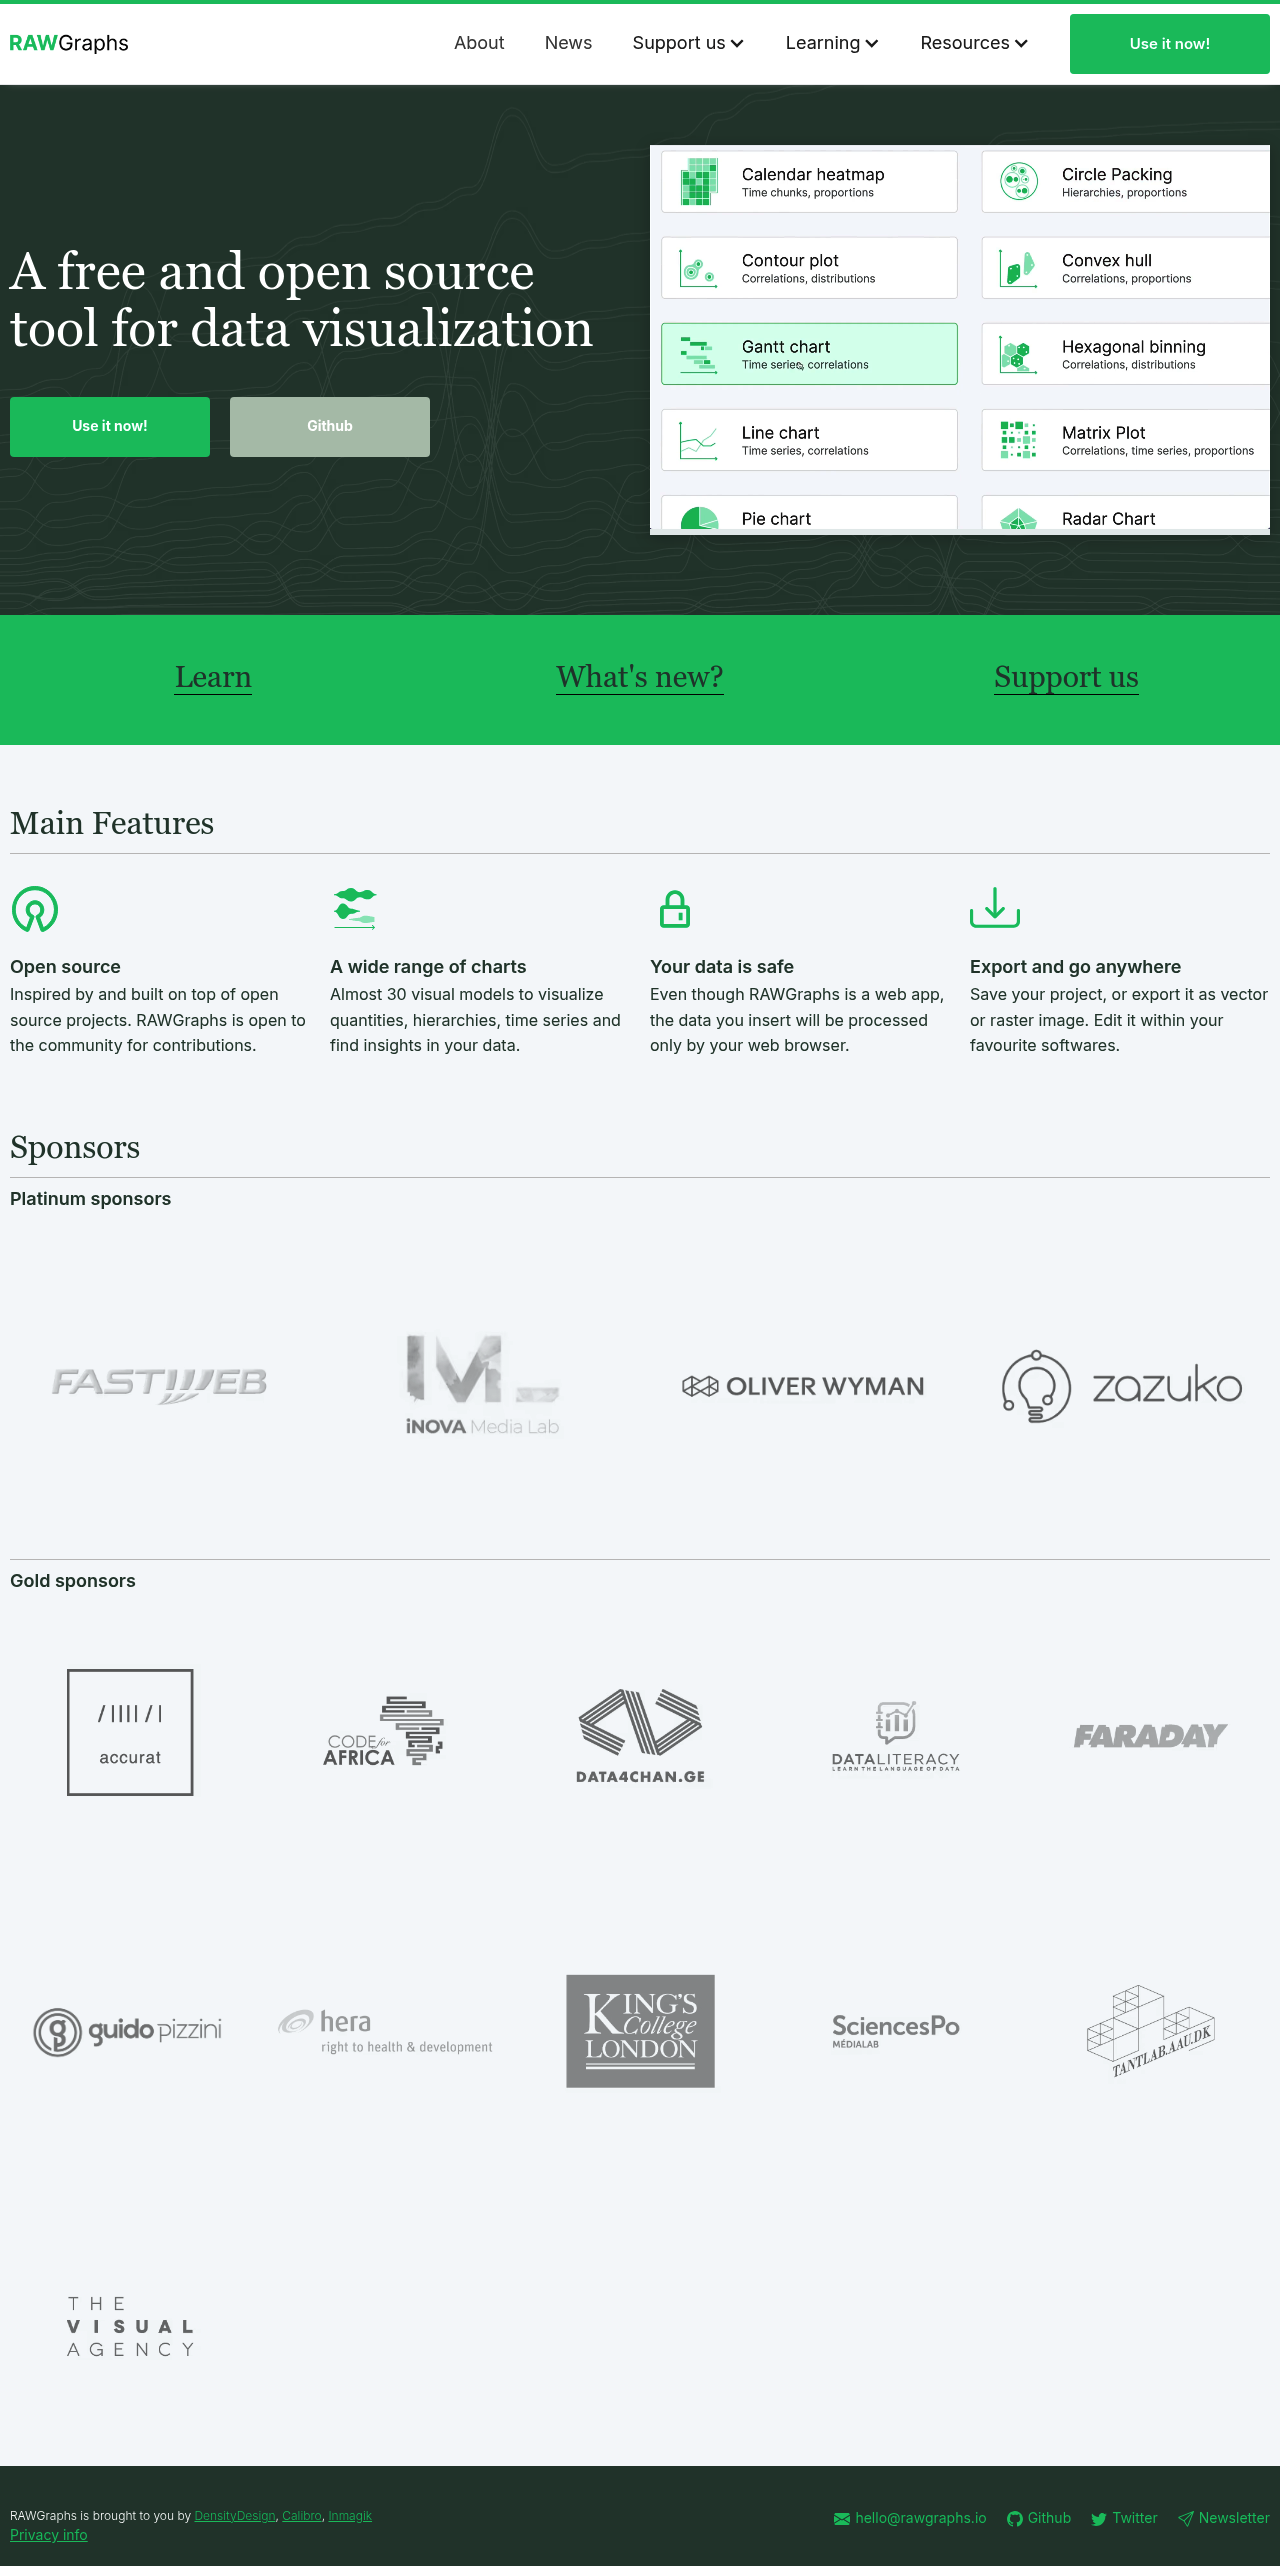
RAWGraphs is a free, open-source data visualization tool that empowers you to create stunning, custom charts and graphs directly in your browser.

Data & DatabasesFreemium

Boost this tool

Subscribe to listing upgrades or segmented pushes.

Log in to purchase

Overview

RAWGraphs is a web application designed to create custom vector graphics from tabular data. It distinguishes itself by offering a drag-and-drop interface, allowing users to quickly transform data into visually appealing and informative charts without coding. It serves as a bridge between basic spreadsheet software and more complex data visualization tools.

Key Features

  • Users can upload data in various formats, including CSV, TSV, or copy-pasted data.
  • Offers a wide range of chart types, such as scatter plots, treemaps, and parallel coordinates.
  • Allows mapping of data columns to chart dimensions for complete control over visual representation.
  • Visualizations can be exported as SVG or PNG files.
  • Data processing occurs within the browser, ensuring data privacy.

Who It's For

RAWGraphs is particularly useful for:

  • Designers
  • Data journalists
  • Researchers
  • Anyone needing to visualize data in a creative and customized way, especially those without coding skills.

Key Features

Wide range of chart types - choose from almost 30 visual models to represent your data.
Open-source - contribute to the project and customize it to your needs.
Data privacy - all data processing happens locally in your browser.
SVG and PNG export - easily integrate visualizations into other applications.
Customizable mapping - map data dimensions to visual variables for complete control.
Tabular data input - directly upload CSV, TSV, or copy-paste data.
Web-based application - accessible from any modern web browser without installation.
No coding required - create complex visualizations without writing any code.

Use Cases & Problems Solved

Use Cases

  • Use when you need to create custom data visualizations beyond the standard chart types offered by spreadsheet software.
  • Perfect for data journalists who need to present data in a visually engaging and informative way.
  • Ideal if you need to explore different ways of visualizing your data to uncover hidden patterns and insights.
  • Use when you want to create visualizations that are easily editable in vector graphics software like Adobe Illustrator.
  • Perfect for researchers who need to present their findings in a clear and compelling visual format.
  • Ideal if you need a data visualization tool that prioritizes data privacy by processing data locally in your browser.

Problems Solved

  • Eliminates the limitations of standard charting software by providing a wider range of customizable chart types.
  • Reduces the learning curve associated with complex data visualization libraries that require coding knowledge.
  • Removes the need to share sensitive data with external servers, ensuring data privacy and security.
  • Eliminates the tedious process of manually creating custom visualizations in vector graphics software.

Who It's For

Data journalistsUX/UI designersResearchersData analystsInfographic creatorsStudents learning data visualization

Fit Analysis

Best For

Best for data professionals and creatives who need to generate unique and customizable data visualizations without relying on complex coding or expensive software.

Not Ideal For

Not ideal for users needing interactive dashboards or real-time data updates, as RAWGraphs focuses on static, exportable visualizations.

Metrics

Discovered1/16/2026
Reviews0
Saved By0 users

Related Tools

Rawgraphs Review, Pricing & Alternatives (2026) | Flaex AI