Back to Database
Developers
VERIFIED

Developers

0.0(0)

Create interactive charts and dashboards for your website with Google Charts, a free and powerful tool for data visualization.

Dev ToolsFreemium

Boost this tool

Subscribe to listing upgrades or segmented pushes.

Log in to purchase

Overview

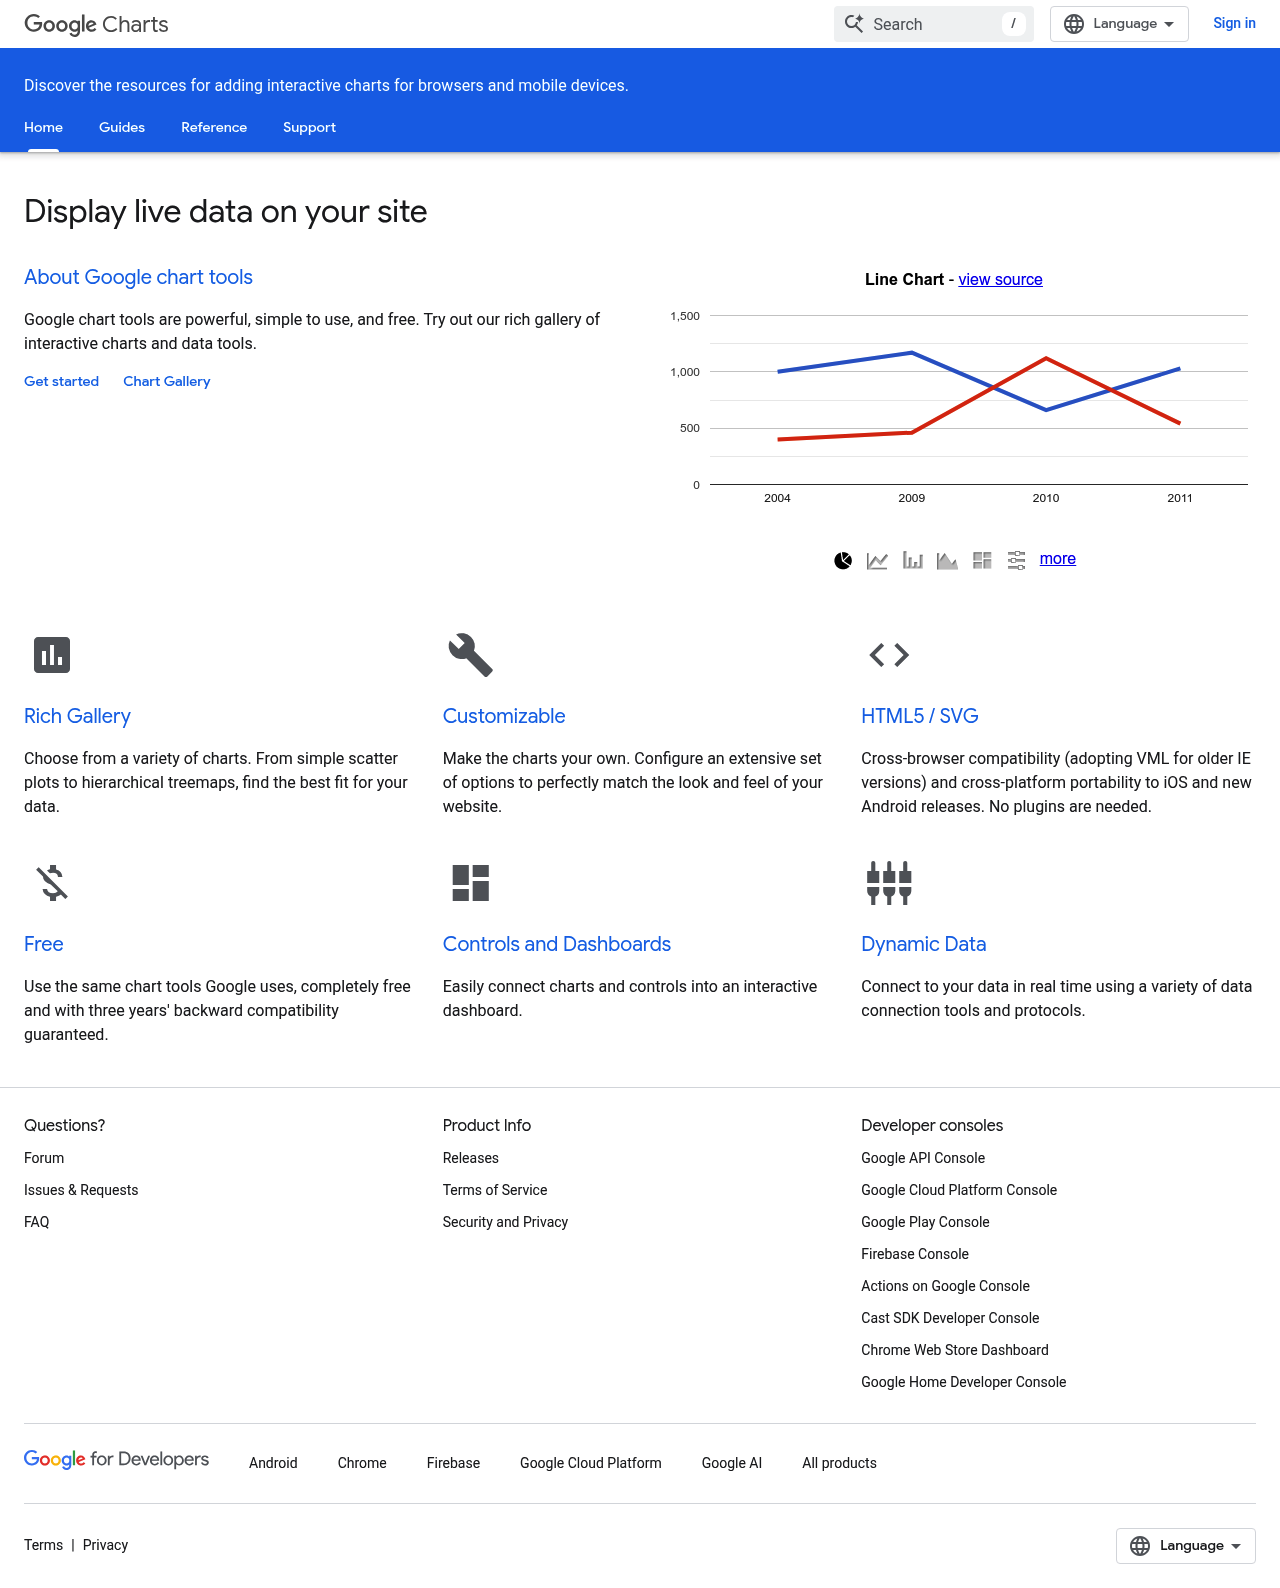
Google Charts is a free platform for creating interactive charts and data visualizations. It offers a variety of chart types, from scatter plots to treemaps, all customizable. It allows users to transform raw data into engaging visuals that enhance user experience and provide valuable insights.

Key Features

  • Offers a rich gallery of chart types.
  • Charts are customizable to match any website's look and feel.
  • Uses HTML5/SVG technology for cross-browser compatibility.
  • Integrates with web applications using dynamic data connections.
  • Supports real-time data connections.
  • Enables the creation of interactive dashboards with controls.

Who It's For

Google Charts is ideal for developers, data scientists, marketers, and analysts who need to present data visually. It's a fit for businesses looking to embed dashboards into their websites, create reports, or develop data-driven applications.

Key Features

Rich gallery of chart types - Choose from a wide variety of charts, including bar, line, pie, and geographical maps.
Customizable charts - Configure chart options to match your website's look and feel.
HTML5/SVG based - Ensures cross-browser compatibility and cross-platform portability.
Dynamic data connections - Connect to real-time data using various data connection tools and protocols.
Interactive dashboards - Easily connect charts and controls into an interactive dashboard.
Free to use - Use the same chart tools Google uses, completely free.
Three years' backward compatibility guaranteed - Ensures long-term stability and reliability.
Controls and dashboards - Create interactive dashboards using controls to filter and manipulate data.

Use Cases & Problems Solved

Use Cases

  • Use when you need to embed interactive charts into your website or application.
  • Perfect for creating data-driven dashboards that allow users to explore information.
  • Ideal if you need to visualize data from various sources in real-time.
  • Use when you want to create custom charts that match your brand's aesthetic.
  • Perfect for developing engaging reports and presentations with interactive visuals.
  • Ideal if you need a free and easy-to-use charting tool with cross-browser compatibility.

Problems Solved

  • Eliminates the need for complex and costly data visualization software.
  • Reduces development time by providing pre-built chart templates and customization options.
  • Solves cross-browser compatibility issues by leveraging HTML5/SVG technology.
  • Simplifies the process of connecting to real-time data sources.
  • Removes the barrier to entry for creating professional-quality charts and dashboards.

Who It's For

Web developersData scientistsMarketing analystsBusiness intelligence professionalsSoftware engineersData journalists

Fit Analysis

Best For

Best for developers and data analysts who need a free, customizable, and easy-to-use solution for embedding interactive charts and dashboards into their websites or applications.

Not Ideal For

Not ideal for users requiring highly specialized or niche chart types not offered in the standard Google Charts library.

Metrics

Discovered1/16/2026
Reviews0
Saved By0 users

Related Tools